
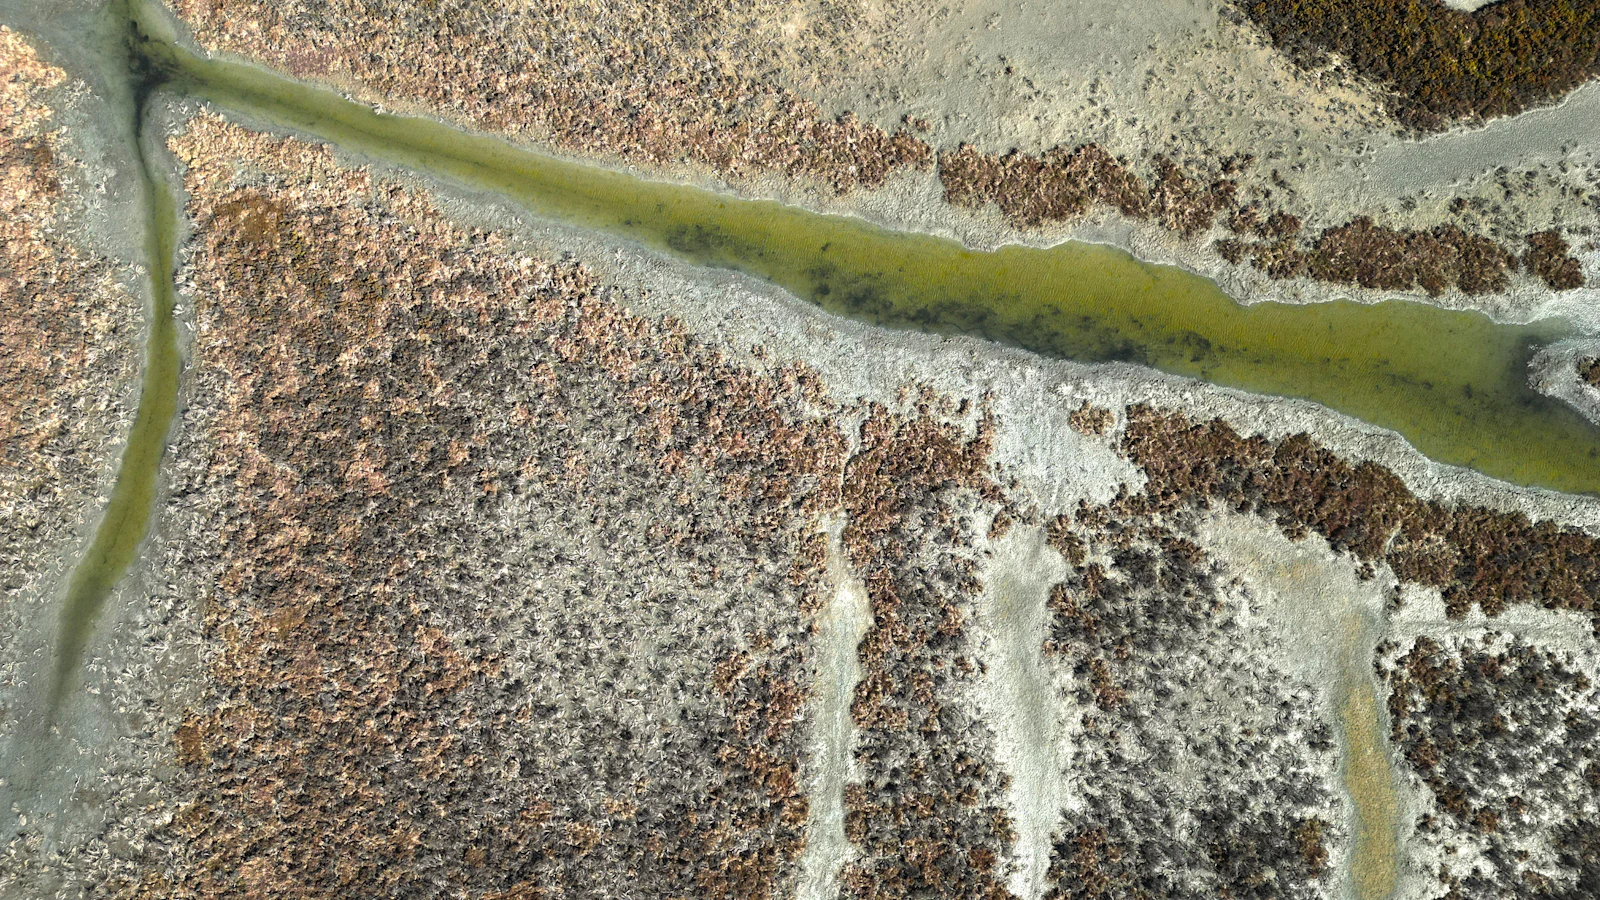
The question
Where does water reach the surface, and will the planned sites sample it?
A client with ground in the Argentine Puna was preparing a sampling campaign that included water and salt crusts, to test a possible brine target. The sites had been placed for stream sediments. Before the crew left, the client wanted to know where water and crusts were likely to be found, and whether any site needed to move or be added.
The data available
We searched the public record first. Nobody had published a water analysis for this ground.
- What neighbours and researchers had published. Technical reports and public filings of the operators on neighbouring ground, and the scientific papers on the waters of the region. The nearest published water analyses were tens of kilometres away, on the far side of the basin. One operator's report describes the streams from this side of the basin sinking into the alluvial fans.
- Open satellite images. 24 cloud-free dates over seven years, at 10 m per pixel.
- Two open elevation models, at about 30 m and about 90 m.
- From the client: the concession outlines, the planned sampling sites, and photographs from an earlier visit showing a channel with water and whitish crusts.
What was done
- Mapped what persists. For every pixel we counted the dates on which it was green, wet or pale. Vegetation that is green on most dates in a desert marks water at the surface all year. A patch that stays pale may be a salt crust.
- Located the candidates. Two spring-fed wetlands on the range front, just outside the ground, and two pale patches in an incised channel inside it, on the stretch where the crusts had been photographed.
- Traced where each one drains. From each point we followed the surface downslope on both elevation models, and again after moving the point 20 m in eight directions: 18 paths per point. A result was kept only if all 18 agreed.
- Set the planned sites against the paths. A site counted as downstream of a point if it lay within 50 m of every path.
- Followed the water along the paths. In 100 m stretches below each spring, we looked for green or wet pixels on any date, and compared them with strips to either side.
- Tested the method where the answer was known. The two pale patches lie on the same channel on the images, so the path from the upper one had to pass the lower one. The count of permanently green pixels at the head of each path had to match the mapped wetlands.
The result
| Question | Answer |
|---|---|
| Do the springs drain into the client's ground? | Yes, both, in every one of the 18 paths |
| Are planned sites downstream of them? | Three are, two below one spring and one below the other |
| Does visible water reach those sites? | No. The green ends within a few hundred metres of each spring, well short of the boundary |
| Where are the pale patches? | On a separate channel inside the ground that the springs do not feed |
| Does a planned site sample that channel? | Not reliably. The nearest is a little under 100 m from the modelled line |
What changed in the plan:
- Two points were added on the pale patches, as the first places to look for water and crusts.
- Three existing sites were flagged as the places where spring water would arrive if it flows at all. Noting whether the channel is wet or dry there costs the crew nothing.
- One site was flagged for a decision in the field: a short move puts it on the channel of the pale patches.
- The springs themselves were left out. They are outside the client's ground, and sampling them needs permissions the campaign did not have.
Both checks passed. The path from the upper patch passes within 40 m of the lower one, and the green pixels at the head of each path match the mapped wetlands.